Running Meta Ads without benchmarks is like driving without a speedometer. You may be spending money, generating clicks, or even getting leads—but without knowing what qualifies as a healthy performance, it is difficult to determine whether your campaigns are actually working.
As businesses increasingly rely on Facebook and Instagram advertising for awareness, leads, app installs, and e-commerce sales, understanding the right Meta Ads benchmarks has become essential.
This guide breaks down the key Meta Ads benchmarks for 2026, what each metric means, and how marketers can use these numbers to evaluate and optimize campaigns.
What Are Meta Ads Benchmarks?
Meta Ads benchmarks are reference ranges that help advertisers evaluate campaign performance against typical or desirable results.
However, there is no single “perfect” benchmark for every campaign.
Performance can vary significantly depending on:
- Industry
- Target audience
- Geographic location
- Campaign objective
- Ad creative
- Placement
- Offer
- Funnel stage
- Landing page experience
- Competition
- Seasonality
Therefore, benchmarks should be treated as directional targets rather than guaranteed results.
Meta Ads Benchmarks 2026
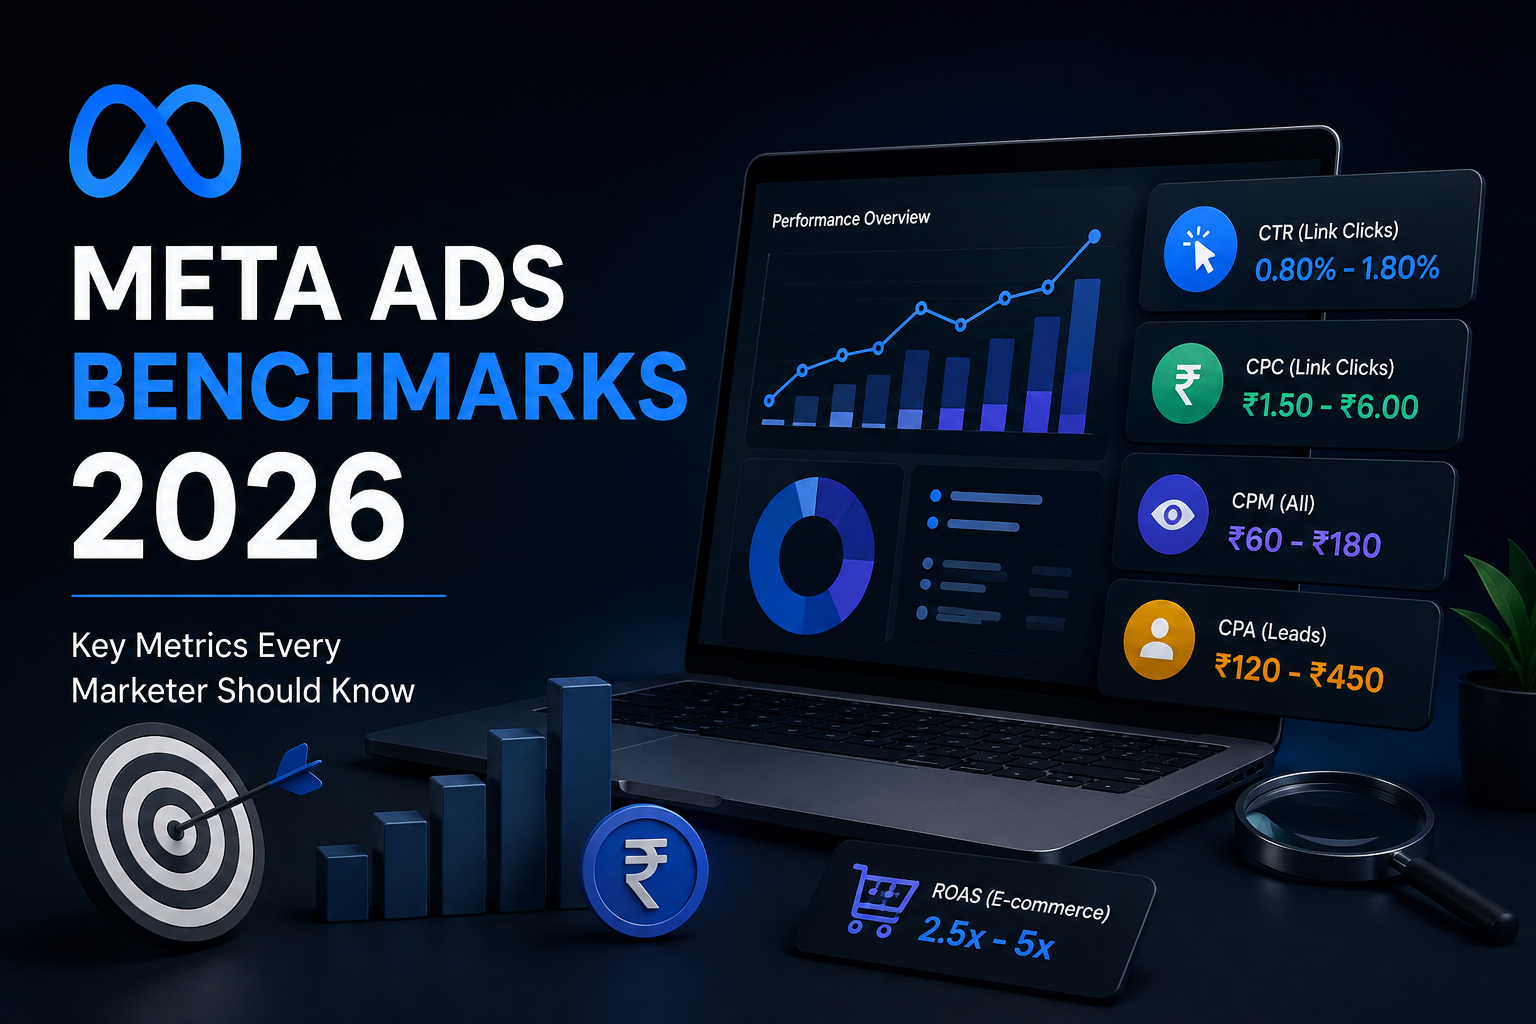
Here is a practical benchmark reference based on the metrics shown in the infographic:
| Metric | Ideal Benchmark |
|---|---|
| CTR (Link Clicks) | 0.80% – 1.80% |
| CTR (All) | 1.20% – 2.50% |
| CPC (Link Clicks) | ₹1.50 – ₹6.00 |
| CPM (All) | ₹60 – ₹180 |
| CPM (Link Clicks) | ₹80 – ₹250 |
| CPA – Leads | ₹120 – ₹450 |
| CPA – Purchases | ₹250 – ₹900 |
| ROAS – E-commerce | 2.5x – 5x |
| Conversion Rate (All) | 2% – 6% |
| Website Conversion Rate | 1.5% – 4.5% |
| App Install Conversion Rate | 10% – 25% |
| Frequency | 1.5 – 3.0 |
| Impression Share | 40% – 70% |
| Landing Page View Rate | 35% – 60% |
| Add-to-Cart Rate | 8% – 20% |
| Cost Per Add to Cart | ₹50 – ₹200 |
| Cost Per Video View | ₹0.20 – ₹1.20 |
| 25% Video View Rate | 15% – 35% |
| 50% Video View Rate | 8% – 20% |
| 75% Video View Rate | 5% – 15% |
| 100% Video View Rate | 3% – 10% |
| Relevance Score | 7/10+ |
| Post Engagement Rate | 3% – 10% |
| Cost Per Page Like | ₹3 – ₹12 |
| Cost Per Message Lead | ₹80 – ₹250 |
| Budget Scaling | Increase 20%–30% every 5–7 days |
Now let’s understand what these metrics actually tell you.
1. CTR (Link Clicks): 0.80% – 1.80%
Click-Through Rate (CTR) measures the percentage of people who clicked the link after seeing your advertisement.
A higher CTR generally indicates that your:
- Creative is attracting attention
- Message is relevant
- Offer is interesting
- Call-to-action is working
For example, if 10,000 people see your advertisement and 120 click the link:
CTR = 120 ÷ 10,000 × 100 = 1.2%
That falls within the benchmark range.
If your CTR is too low
Consider testing:
- A stronger headline
- Better creative
- Different hooks
- Shorter copy
- A clearer CTA
- A more specific audience
But don’t optimize CTR blindly. A high CTR with poor-quality traffic can still produce a losing campaign.
2. CTR (All): 1.20% – 2.50%
CTR (All) measures interactions with the advertisement beyond just link clicks.
Someone might click:
- The image
- The profile
- “See more”
- The CTA
- Another interactive element
This metric can help you understand overall ad engagement.
However, CTR (Link Clicks) is usually more useful when your primary goal is generating website traffic or conversions.
3. CPC (Link Clicks): ₹1.50 – ₹6.00
Cost Per Click (CPC) tells you how much you are paying for each link click.
The benchmark shown is:
₹1.50 –₹6.00 per link click
A low CPC sounds attractive, but it doesn’t automatically mean your campaign is successful.
For example:
Campaign A:
- CPC = ₹2
- 1,000 clicks
- 5 leads
Campaign B:
- CPC = ₹5
- 400 clicks
- 40 leads
Campaign B is far more valuable despite having a higher CPC.
Always connect CPC with conversion rate and CPA.
4. CPM: ₹60 – ₹180
CPM (Cost Per 1,000 Impressions) measures the cost of showing your advertisement 1,000 times.
The infographic gives an ideal range of:
₹60 –₹180
CPM can rise because of:
- Increased competition
- Narrow audiences
- Seasonal demand
- Expensive placements
- Poor ad relevance
- High-value demographics
Don’t immediately assume a high CPM means Meta Ads are performing badly.
A campaign with ₹250 CPM could still be profitable if it generates high-value customers.
5. CPA for Leads: ₹120 – ₹450
Cost Per Acquisition (CPA) measures how much it costs to acquire one desired action.
For lead-generation campaigns, the benchmark shown is:
₹120 – ₹450 per lead
But the acceptable CPA depends heavily on the value of the lead.
For example, a ₹500 lead may be excellent for a business where each converted customer generates ₹50,000 in revenue.
The same ₹500 lead could be unacceptable for a low-ticket business.
The better question is:
“How much can I afford to pay for a qualified customer?”
—not simply—
“Is my CPA below the benchmark?”
6. CPA for Purchases: ₹250 – ₹900
For e-commerce campaigns, the infographic indicates a purchase CPA benchmark of:
₹250 – ₹900
Again, this should be evaluated against your:
- Average order value
- Gross margin
- Customer lifetime value
- Repeat purchase rate
- Shipping costs
- Discounts
A ₹900 CPA might be terrible for a ₹700 product but excellent for a ₹10,000 product.
7. ROAS: 2.5x – 5x
Return on Ad Spend (ROAS) is one of the most important e-commerce metrics.
If you spend ₹10,000 on advertising and generate ₹40,000 in attributed revenue:
ROAS = ₹40,000 ÷ ₹10,000 = 4x
The benchmark shown is:
2.5x – 5x
But don’t confuse ROAS with profitability.
A 3x ROAS doesn’t necessarily mean you are profitable because your business still has:
- Product costs
- Salaries
- Logistics
- Payment gateway fees
- Returns
- Discounts
- Overheads
Your break-even ROAS is therefore more important than a generic industry benchmark.
8. Conversion Rate: 2% – 6%
Conversion rate measures the percentage of visitors who complete the desired action.
Depending on your campaign, that action could be:
- Form submission
- Purchase
- Registration
- Booking
- WhatsApp inquiry
- Phone call
If 1,000 people visit your website and 40 complete the desired action:
Conversion Rate = 4%
That falls within the benchmark range shown.
9. Website Conversion Rate: 1.5% – 4.5%
For website campaigns, the infographic gives a benchmark of:
1.5% – 4.5%
If your ads are getting good CTR but your website conversion rate is poor, the problem may not be your advertising.
It could be the landing page.
Common problems include:
- Slow page speed
- Weak headline
- Poor mobile experience
- Complicated forms
- Lack of trust signals
- Unclear pricing
- Weak CTA
- Offer mismatch
This is why ad optimization and landing-page optimization should be treated as one funnel.
10. App Install Conversion Rate: 10% – 25%
For app-install campaigns, the benchmark shown is:
10% – 25%
This indicates the percentage of relevant users who proceed from the ad interaction to an installation.
However, app marketers should go beyond installs.
Track:
Install → Registration → Activation → Purchase → Retention
Cheap installs that never become active users are not necessarily valuable.
11. Frequency: 1.5 – 3.0
Frequency measures how many times, on average, a person has seen your advertisement.
A benchmark of:
1.5 – 3.0
can be a useful starting point.
If frequency rises too high while performance declines, you may be experiencing creative fatigue.
Symptoms include:
- Falling CTR
- Increasing CPC
- Increasing CPA
- Negative feedback
- Lower engagement
The solution isn’t always to change the audience. Often, the creative needs refreshing first.
12. Impression Share: 40% – 70%
Impression share indicates how much of the available advertising opportunity you are capturing.
The benchmark shown is:
40% – 70%
However, this metric should not be treated as a universal Meta Ads KPI because available impressions and auction dynamics vary by campaign and objective.
A higher impression share isn’t automatically better if you’re paying too much for low-quality traffic.
13. Landing Page View Rate: 35% – 60%
Not everyone who clicks an ad successfully reaches or loads the landing page.
Landing Page View Rate helps identify this gap.
A low rate may indicate:
- Slow website
- Poor mobile performance
- Accidental clicks
- Redirect problems
- Technical issues
If you have a high number of link clicks but relatively few landing-page views, investigate the website experience before increasing your ad budget.
14. Add-to-Cart Rate: 8% – 20%
For e-commerce businesses, adding a product to cart is a major funnel milestone.
The benchmark shown is:
8% – 20%
A strong add-to-cart rate indicates that users are showing meaningful buying intent.
But you also need to track:
View Product → Add to Cart → Checkout → Purchase
A large drop between any two stages indicates a potential problem.
15. Cost Per Add to Cart: ₹50 – ₹200
The infographic gives a benchmark of:
₹50 – ₹200
This helps advertisers understand the cost of generating purchase intent.
But the real KPI remains cost per purchase and profitability.
Don’t optimize the campaign simply because your cost per add-to-cart is low.
16–20. Video Advertising Benchmarks
For video campaigns, several metrics become important.
Cost Per Video View
Benchmark:
₹0.20 – ₹1.20
25% Video View Rate
15% – 35%
50% Video View Rate
8% – 20%
75% Video View Rate
5% – 15%
100% Video View Rate
3% – 10%
These metrics help identify where viewers lose interest.
For example, if many users watch the first 25% but very few reach 50%, the problem may be the middle section of your video.
That means you shouldn’t only ask:
“How many people watched the video?”
Instead ask:
“Where did people stop watching?”
21. Relevance Score: 7/10+
The infographic recommends:
7/10 or higher
as a desirable relevance indicator.
The basic principle remains important: the more relevant the ad is to the audience, the better the potential user response.
Relevance can be improved through:
- Better audience targeting
- Stronger creative
- Relevant messaging
- Clear offers
- Better landing pages
However, advertisers shouldn’t obsess over one diagnostic score. Business outcomes matter more than a platform’s quality indicator.
22. Engagement Rate: 3% – 10%
Engagement rate measures how many people interact with your post.
Engagement can include:
- Likes
- Comments
- Shares
- Saves
- Other interactions
For awareness and engagement campaigns, this can be useful.
For lead generation or e-commerce, however, engagement should not become a vanity metric.
10,000 likes don’t matter if they generate zero business value.
23. Cost Per Page Like: ₹3 – ₹12
If your objective is growing your Facebook Page audience, the benchmark shown is:
₹3 – ₹12 per page like
But page likes are increasingly less important than:
- Qualified leads
- Website visitors
- Purchases
- Engagement
- Retargeting audiences
- Customer relationships
Use this metric only when page growth itself has strategic value.
24. Cost Per Message Lead: ₹80 – ₹250
For businesses using Messenger or similar messaging-based lead generation, the infographic gives a benchmark of:
₹80 – ₹250 per lead
But there is an important distinction:
Message ≠ qualified lead ≠ customer.
You should track the complete journey:
Ad → Message → Qualified Lead → Sales Conversation → Customer
This will give you a much clearer picture of campaign profitability.
25. Budget Scaling: Increase 20%–30% Every 5–7 Days
The infographic recommends gradually increasing budgets by:
20%–30% every 5–7 days
The underlying principle is sound: avoid making aggressive budget changes when a campaign is still producing unstable results.
But don’t treat 20%–30% as a rigid Meta rule.
If a campaign is clearly profitable and stable, the right scaling strategy depends on:
- Audience size
- Conversion volume
- CPA
- ROAS
- Creative fatigue
- Margins
- Campaign structure
Scaling should be based on economics and stability, not an arbitrary percentage.
The Biggest Mistake: Optimizing Individual Metrics
This is where many advertisers go wrong.
Suppose you have:
CTR: 2.5%
CPC: ₹2
CPM: ₹50
It looks excellent.
But if:
Conversion Rate: 0.5%
CPA: ₹800
ROAS: 1.2x
the campaign may still be losing money.
The opposite can also happen.
You could have:
CTR: 0.9%
CPC: ₹6
CPM: ₹200
Yet:
Conversion Rate: 6%
CPA: ₹300
ROAS: 4x
That campaign may be far more valuable.
The lesson:
Don’t optimize the metric. Optimize the business outcome.
A Better Meta Ads Optimization Framework
Instead of looking at metrics individually, analyze your funnel in stages.
Stage 1: Attention
Track:
- CPM
- CTR
- Video View Rate
- Engagement
Question: Are people responding to the creative?
Stage 2: Traffic
Track:
- CPC
- Link Clicks
- Landing Page Views
- Landing Page View Rate
Question: Are people reaching the destination?
Stage 3: Intent
Track:
- Add to Cart
- Lead Initiations
- Messages
- Checkout Initiations
Question: Are visitors showing buying or conversion intent?
Stage 4: Conversion
Track:
- Purchases
- Leads
- Conversion Rate
- CPA
Question: Are users actually converting?
Stage 5: Revenue
Track:
- Revenue
- ROAS
- Customer Acquisition Cost
- Customer Lifetime Value
Question: Is advertising generating profitable growth?
How to Use These Benchmarks in 2026
Don’t copy these numbers into a dashboard and declare campaigns successful or unsuccessful.
Instead, use them as diagnostic ranges.
For example:
Low CTR + High CPC
Likely issue:
Creative / messaging / audience
Test new:
- Hooks
- Visuals
- Headlines
- Offers
- Audiences
Good CTR + Poor Conversion Rate
Likely issue:
Landing page / offer / sales funnel
Improve:
- Page speed
- Copy
- CTA
- Trust elements
- Offer
- Form
Good Conversion Rate + High CPA
Likely issue:
Traffic cost or audience economics
Investigate:
- CPM
- CPC
- Audience size
- Targeting
- Competition
Good CPA + Poor ROAS
Likely issue:
Customer value / order value / margins
Consider:
- Upsells
- Bundles
- Higher AOV
- Better pricing
- Repeat purchases
The Meta Ads benchmarks for 2026 provide useful reference points for advertisers, but there is no universal number that defines a successful campaign.
A CTR of 1.5%, CPC of ₹4, or CPA of ₹300 doesn’t mean much without knowing the campaign objective and business economics.
The most effective approach is to evaluate the entire funnel:
Creative → Click → Landing Page → Intent → Conversion → Revenue → Profit
Use benchmarks to identify potential problems, but use conversion data, customer value, profitability, and ROAS to make the final decision.
And remember: a campaign doesn’t need to beat every benchmark to be successful. It needs to produce profitable results for your specific business.